
Data insights on our Diet – Eat healthy and stay healthy
This is the final part of my study on data insights on our diet. Health is considered the true wealth. Key metrics of healthy food, access to healthcare and longer life expectancy defines the health of nation.
With globalization, all the nations are evolving with hybrid food habits. This has tilted nutritional balance of the individual. Especially, this is more prevalent in the urban population compared to the rural population. On one side, there are issues of obesity and on the other, undernourishment. If one takes lots of food, it is not enough. The food containing right nutrients is important for stronger immune systems, reducing long term ailments and leading a quality life.
In my analysis of obesity and undernourished percentages based on data, some very interesting insights can be derived. While malnutrition needs to be addressed to develop healthy population, at the same time a check on obesity is required. Obesity is one of the leading causes of various chronic conditions among the people.

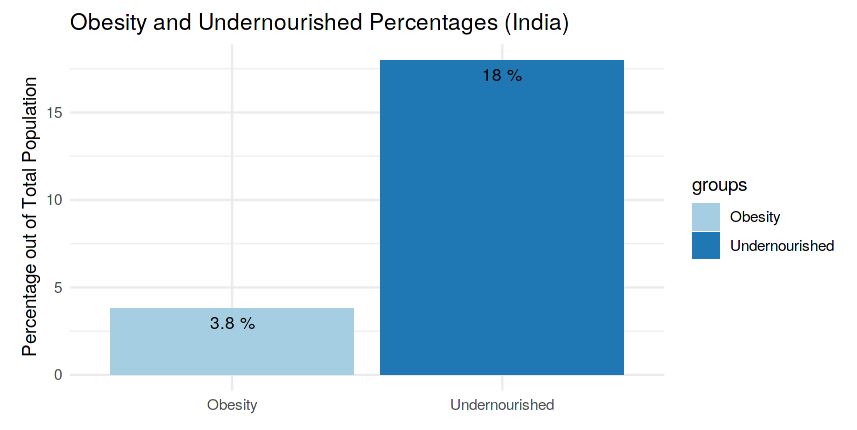

Looking at the obesity and undernourished rate bar plot above, both US and Japan have very low undernourished rate, yet there is a huge difference between obesity rate – US obesity percentage is almost 10 times the obesity rate in Japan!. On the other hand India’s undernourished populations is at 18% and at the same time, obesity is at 3.8% with respect to total population. Just by population metrics India is much more populated than Japan, but the 4% of obesity in each country is quite different in sheer number. This definitely is alarming for India to ensure healthy food habits are adopted and more awareness and messaging is required. Same goes to US population and number of studies reflect on growing problems with obesity. No wonder fast food chains are promoting and adding salads and fruit juices to the main menus.
No one can explain better than Isha Sadhguru on Food and types of food we should take, watch the below video.
Conclusion
After looking through the food patterns in each of the plots above, there are a lot of interesting trends observed:
- US in general consumes a lot of food supplies that are in the sugar/sweeteners, milk, meat, and animal product
categories. - India in general consumes a lot of food supplies that are in the vegetal products, milk, meat and spices categories.
- Japan, similar to India in some segments, consumes a lot of food supplies that are in the vegetal products and fish/seafood categories.
- Higher percentage of sugar/sweeteners is probably the reason why US has a significantly higher amount of obesity than
India or Japan - Source of proteins and energy for US population comes significantly from animal products while in India, the source is from vegetable, cereal products. In Japan sources are from vegetable, cereals and sea food. This indicates having more combinations of vegetable and cereals in our daily routine is healthy
- India has very high percentage of undernourished population compared to US and Japan. This indicates affordable and good food
supply chain process is much more robust and efficient in US and Japan in reaching more people. India can learn a lot and build better infrastructure to create food supply chain - Connecting all the observations, this analysis proves that source of healthier diet is one of the most important steps to focus on improving immunity in fighting with any epidemic and pandemics.
In this global pandemic situation, we all are caught in confusion, helplessness and anxiety on way forward for living. Nearly 200 million people are working in finding the cure for Covid-19 and world over healthcare investments is growing at 4 times rates compared to previous year to find resolutions for better healthcare.
As our part lets revisit on what we are eating and how we are eating to personally take a resolution to improve immunity.
Eat healthy and stay healthy!!!
Y.prathyusha I am still studying 3rd year .
If any vaccines tell me sir my what’s up number 7095496134
Your number send me sir
You can send me email on tipparaju@hotmail.com